Temperature Monitoring
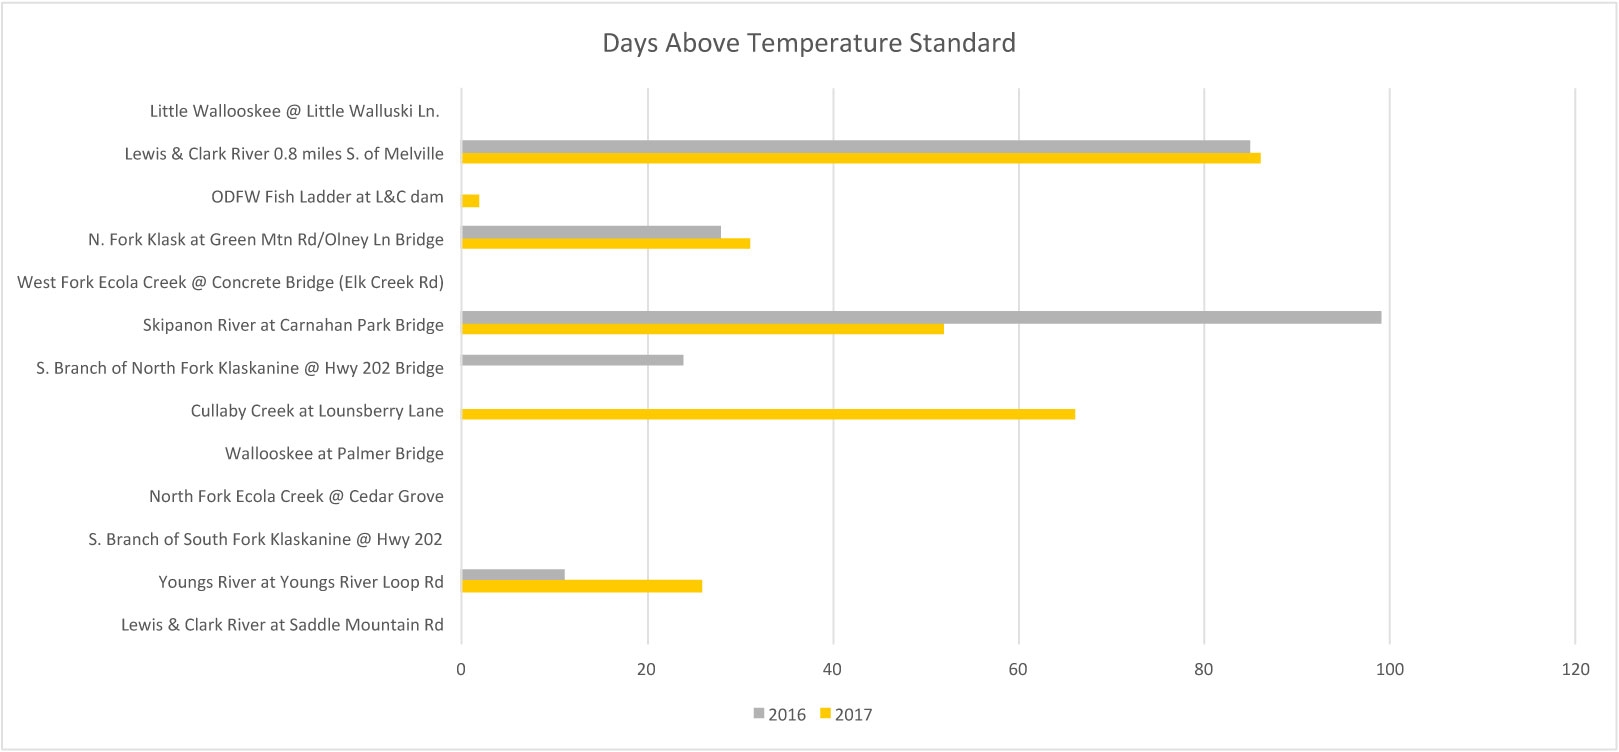
In 2016, the North Coast Watershed Association began a temperature monitoring program to observe watersheds’ summertime high temperatures in our service area. Water temperature is a limiting factor for survival of salmon and other cold-water fish and an indicator of the amount of dissolved oxygen in the water – an important factor for the health of all species in the watershed, including us.
With continuous, long-term temperature data collection we are able to identify areas within our watershed that will benefit most from our work. We can also share the information with the public and other agencies working within these watersheds and we’re assisting the Oregon Department of Environmental Quality (ODEQ) to establish water quality data.
Click the temperature monitoring sites listed on the left to learn more about each site. Temperature is compared to the ODEQ water quality standard summertime temperature for rearing and migration of salmonids (18°C, 64.4°F). Email us if you would like copies of Excel spreadsheets of our raw data from 2016-2022.
Below is a map which shows stream temperature data aggregated for our area over many years of collaborative efforts with each waterway coded from red (hottest) to blue (coolest). Red stars represent the known limits of regular tidal influence (head of tide), black dots are our data loggers, and blue shaded areas (visible when you zoom in) are designated wetlands.

